GEE Timeseries Explorer
Disclaimer: this website was tested with the Google Chrome webbrowser. If your webbrowser has problems, e.g. running videos, you may switch.
Overview
GEE Time Series Exlorer is a QGIS plugin for interactive exploration of temporal raster data available via the Google Earth Engine (GEE) Data Catalog.
The GEE Time Series Exlorer plugin adds a panel for selecting a GEE image collection and a plot widget for visualizing temporal profiles.
- Version 2.0 with complete GUI overhaul
- Slides from the Living Planet Symposium 2022 talk in Bonn, Germany
Janz, A. et al. (2022, May 26). GEE Time Series Explorer: Planetary-scale visualization and temporal profile sampling of EO imagery from the Earth Engine Data Catalog in QGIS and the EnMAP-Box [oral presentation]. Living Planet Symposium, Bonn, Germany
- How to cite
Rufin, P., Rabe, A., Nill, L., and Hostert, P. (2021) GEE TIMESERIES EXPLORER FOR QGIS - INSTANT ACCESS TO PETABYTES OF EARTH OBSERVATION DATA , Int. Arch. Photogramm. Remote Sens. Spatial Inf. Sci., XLVI-4/W2-2021, 155-158, https://doi.org/10.5194/isprs-archives-XLVI-4-W2-2021-155-2021, 2021.
Important
Version 2.0 is a complete overhaul and reimplementation of the plugin. The code base moved into the EnMAP-Box 3 plugin.
The GEE Time Series Explorer can still be used from within the QGIS main window, and additionally, from the EnMAP-Box 3 main window.
Installation
In QGIS select QGIS > Plugins > Manage and Install Plugins…, search for GEE Timeseries Exlorer and install the plugin.
Note: this plugin relies on the Earth Engine API. In order to access Earth Engine, you must have an Google account that is authorized for Earth Engine. If you haven’t used Earth Engine so far, the easiest way to make sure that it is working on your system, is to use the web-based Code Editor: https://code.earthengine.google.com/
Important
As mentioned above, with Version 2.0, the code base moved into EnMAP-Box 3 plugin, which is now a dependency for the GEE Time Series Explorer. After installation, you may check, if the EnMAP-Box 3 plugin version 3.10.0.20220524T082114 is correctly installed. If not, you can also install it manually. Be sure to allow experimental plugins! Note that EnMAP-Box v3.9 won’t work.
Getting started
- Show the GUI
In the QGIS toolbar click
 to show the GEE Time Series Exlorer panels.
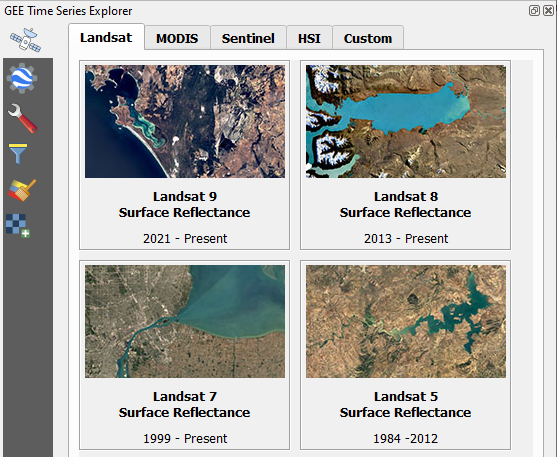
GEE Time Series Explorer main panel, showing the Data Catalog tab with Landsat collections.
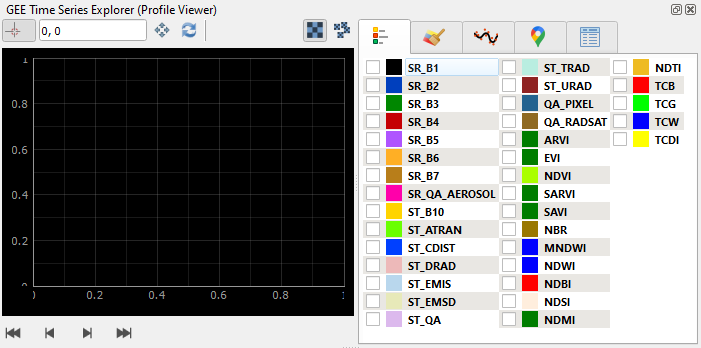
GEE Time Series Explorer (Profile Viewer) panel.
- Load a collection, plot a temporal profile and visualize an image
Select the Landsat 8 Surface Reflectance collection in the Data Catalog tab of the main panel.
Select the NDVI band in the Profile Viewer panel.
Activate the Current Location map tool
 and select a location on the map.
This will plot the temporal profile for that location in the Profile Viewer panel.
and select a location on the map.
This will plot the temporal profile for that location in the Profile Viewer panel.Select a data point in the plot to visualize the associated image. The image is displayed in it’s default visualization.
- Improve image contrast stretch
The default visualization may give a poor image contrast, which you may want to improve. In the Band Rendering tab of the main panel, you may set suitable min/max values manually, or specify lower/upper percentile cut off values, e.g. 2% to 98%. Note that the statistics are calculated for the current map extent.
- Visualize derived vegetation indices
Beside visualizing original image bands in Multiband color RGB, it is possible to visualize derived vegetation indices.
- Prepare a cloud-free composite
To create a composite that aggregates all images in a given date range, we just switch from Image Selection mode to Composite Selection mode in the Profile Viewer panel. In the plot we can now select a date range and create our first, very cloudy, composite. By applying a Pixel Quality Filter we can easily exclude all pixel affected by cloud and cloud shadow. And finally, we can improve the contrast stretch of the visualization.
Warning
The rest of the documentation is currently under construction and will be available soon.
Contact
Please provide feedback to Andreas Rabe (andreas.rabe@geo.hu-berlin.de) or create an issue.